📊 Full opportunity report: Bitcoin Battles Unfold in Live Warzone Visualization on ThorstenMeyerAI.com — validation score, market gap, and execution plan.
TL;DR
A new online tool visualizes Bitcoin trading activity as a live war scene, connecting directly to Binance and Coinbase streams. It offers an immersive, real-time depiction of market battles without providing trading advice. The project highlights advances in browser technology for creative data visualization.
A new web-based visualization called Bitcoin War has gone live, transforming live Bitcoin trading data into a dynamic, cinematic battlefield. Developed by isbitcoindead.com, the tool connects directly to Binance and Coinbase streams, depicting the ongoing tug-of-war between buyers and sellers in real time. It does not provide trading signals or advice, but offers an artistic, visceral view of market activity that has attracted attention for its innovative use of browser technology.
The visualization employs a combination of Canvas 2D graphics, WebAudio synthesis, and real-time WebSocket streams to create an immersive experience accessible in any modern browser. Market activity appears as a battlefield, with buy orders from the ‘Cobalt Host’ pushing the front line from the left, while sell orders from the ‘Ember Legion’ push from the right. Large liquidations are visualized as airstrikes, adding a visceral element to the scene. An automatic camera system shifts perspectives, focusing on key skirmishes or providing broad overviews, while a live DEFCON meter indicates market volatility. The project’s minimal footprint—roughly 180KB—demonstrates how advanced web technologies can be used for creative data visualization without backend infrastructure. The visualization includes a live scrolling war log narrating ongoing activity and a synthetic soundtrack generated within the browser to heighten the experience. A comprehensive scoreboard tracks seconds won, casualties, and dollar gains, creating a narrative of market dynamics. Importantly, the project emphasizes that it is not a trading tool but an artistic depiction of market chaos, with a footer stating, ‘a live reading of the BTC/USDT tape · no advice, only war.’
Implications of Visualizing Market Data as a War Scene
This project exemplifies how modern web technologies can be harnessed to create engaging, artistic representations of complex financial data. By visualizing Bitcoin trading activity as a battlefield, it offers a new perspective on market volatility, liquidity, and order flow. While it is not a trading tool, the visualization can help viewers better understand the raw chaos and intensity of crypto markets. It also pushes the boundaries of data visualization, demonstrating that real-time market streams can be turned into immersive, cinematic experiences accessible to a broad audience. This innovation may inspire further creative uses of live financial data for educational or entertainment purposes, emphasizing transparency and immediacy in market analysis.

Bitcoin Merch Gold Nugget Lottery Miner, WiFi-Enabled Bitcoin Solo Miner, 377 KH/s Hashrate, Ultra-Low Power Consumption, Compact Design
SOLO BITCOIN MINING: Compact WiFi-enabled device that connects you to the Bitcoin network for solo mining with a…
As an affiliate, we earn on qualifying purchases.
As an affiliate, we earn on qualifying purchases.
Background and Development of the Bitcoin War Visualization
The visualization was developed by isbitcoindead.com as a demonstration of how browser-based technologies can be used for real-time data art. It connects directly to Binance’s public WebSocket streams, with a fallback to Coinbase, ensuring continuous data flow. The project was launched in early April 2024 and has since gained attention for its unique approach to depicting market activity. It builds on recent advances in web graphics, audio synthesis, and stream processing, all executed client-side without backend servers, making it lightweight and accessible. The visualization is part of a broader trend toward interactive, artistic representations of financial markets, blending technology, art, and data science.
“This project showcases the potential of browser technology to create immersive, real-time visualizations that go beyond traditional charts and graphs.”
— an anonymous researcher
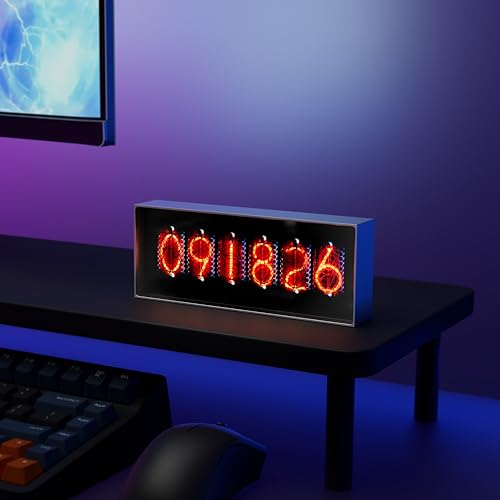
Electronic Display for Real-Time Cryptocurrency/Bitcoin/Stock Market Data, Time, Weather & Temperature, 164*28*65mm, Supports Image Upload and 30s Video Playback, App-Controlled, 960*360 Resolution
Real-Time Data Display – Shows live cryptocurrency (Bitcoin), stock market trends, time, weather, and temperature updates at a…
As an affiliate, we earn on qualifying purchases.
As an affiliate, we earn on qualifying purchases.
What Aspects of the Visualization Are Still Developing?
It is not yet clear how widely the visualization will be adopted or whether similar tools will emerge for other assets or markets. The long-term impact on market analysis or trading behavior remains uncertain. Additionally, although the project claims to be purely artistic, some viewers may interpret it as a form of market commentary or prediction, which has not been officially confirmed.

CryptoTicr Bitcoin Ticker – Real-Time Crypto Price Display (1.54" Diagonal) for Top 1,000 Coins Like Bitcoin, Ethereum, Dogecoin, and 997 more. Compact Size, Ideal for Desk or Nightstand. Uses Wi-Fi.
CryptoTicr is a passion project of a dedicated USA-based creator focused on crafting the finest cryptocurrency ticker available….
As an affiliate, we earn on qualifying purchases.
As an affiliate, we earn on qualifying purchases.
Future Plans for the Bitcoin War Visualizer
Developers may enhance the visualization with additional features, such as more detailed analytics or interactive elements. There is also potential for expanding to other cryptocurrencies or integrating educational components. The project’s creators have indicated that they are exploring ways to make the visualization more customizable and accessible, but no official updates have been provided on specific plans or timelines.

12Pcs Trading Chart Pattern Posters Candlestick Pattern Poster Bulletin Board Crypto and Stock Market Trading Poster Office Decorations for Trader Investor Supplies Wall Door Decor 11 x 15.7 Inches
Package includes: This set includes 12 trading chart pattern posters and 100 adhesive dots, providing you with all…
As an affiliate, we earn on qualifying purchases.
As an affiliate, we earn on qualifying purchases.
Key Questions
Is the Bitcoin War visualization a trading tool?
No, it is an artistic, data-driven visualization designed to depict market activity visually. It does not offer trading signals, advice, or wallet integrations.
How can I access the visualization?
It is available for free at war.isbitcoindead.com and runs instantly in any modern browser.
What technology does the visualization use?
It leverages Canvas 2D graphics, WebAudio synthesis, and WebSocket streams, all processed client-side without backend infrastructure.
Does the visualization reflect real-time market conditions accurately?
Yes, it connects directly to live Binance and Coinbase streams, providing a real-time depiction of trading activity, but it is not a predictive or trading tool.
Are there plans to expand or improve the project?
Developers have indicated potential future enhancements, including more detailed analytics and customization options, but no specific timelines have been announced.
Source: ThorstenMeyerAI.com